Preface
Welcome to Stambia Analytics!
This guide contains information about how to administer and monitor Stambia using Stambia Analytics
Audience
This document is intended for users interested in using Stambia Analytics to parameterize Packages and go into production, schedule executions, follow up the session’s executions, view sessions' details, ... .
Document Conventions
This guide uses the following formatting conventions:
| Convention | Meaning |
|---|---|
| boldface | Boldface type indicates a graphical user interface associated with an action, or a product specific term or concept. |
| italic | Italic type indicates a special emphasis or placeholder variable that you need to provide. |
monospace |
Monospace type indicates code example, text or commands that you have to enter. |
Other Stambia Resources
In addition to the product manuals, Stambia provides other resources available on its company website: www.stambia.com and community website www.stambia.org.
Obtaining Help
To get help you can:
- contact our global Technical Support Center: www.stambia.org/di/support.
- consult the articles on our community website www.stambia.org.
- consult or post topics on our forum on www.stambia.org.
Feedback
We welcome your comments and suggestions on the quality and usefulness of this documentation.
If you find any error or have any suggestion for improvement, please contact us at www.stambia.org/di/support and indicate the title of the documentation along with the chapter, section, and page number, if available. Please let us know if you want a reply.
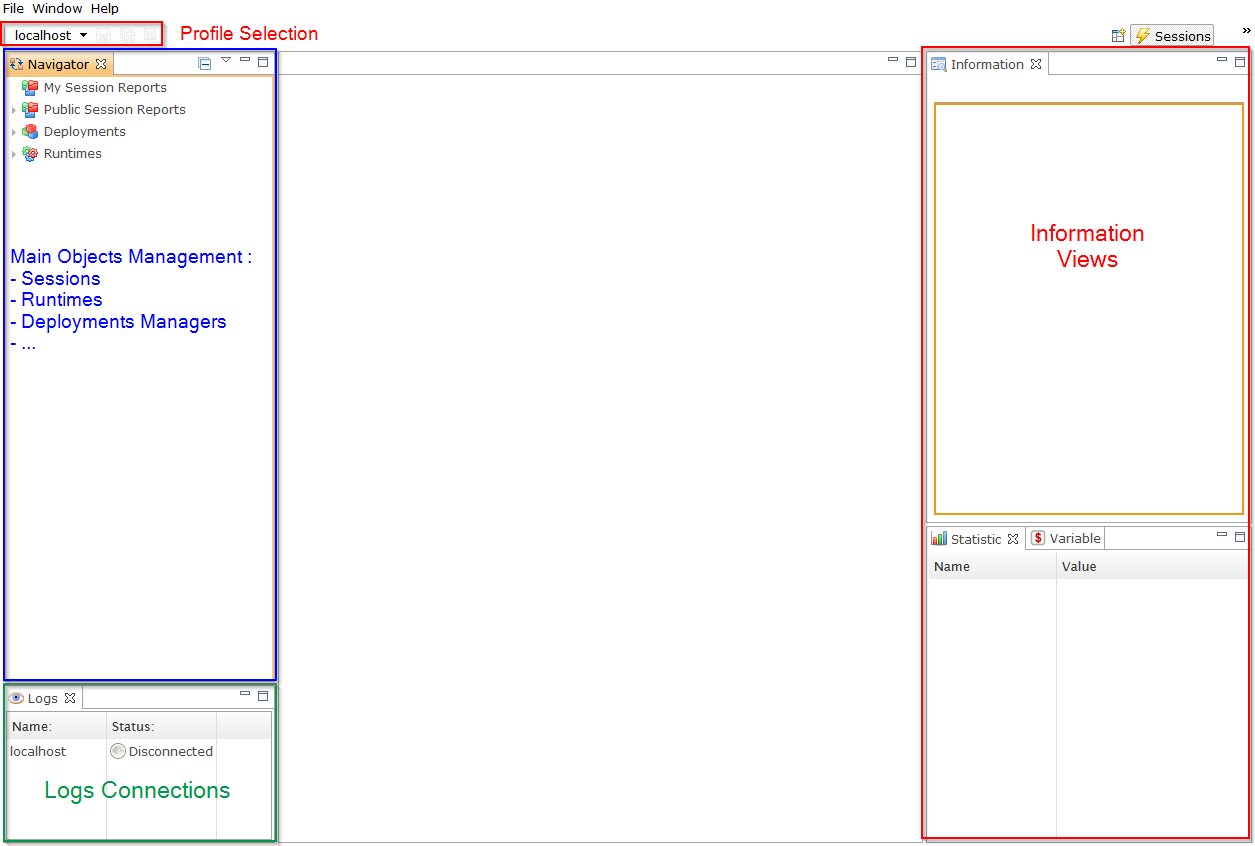
Overview of the Stambia Analytics graphical interface
Here is an overview of Stambia Analytics graphical interface:
Managing Sessions
Defining Session Reports
Session Reports are used to gather, filter and visualize a list of sessions based on the criteria defined by the user.
Creating Session Reports
To create a new Session Report:
- Right click in the Public Session Reports topic
 in the navigator view
  .
. - Choose "New Session Report"
- Give a name to the Report
- Modify the criteria, as explained below
- Save and click on the Refresh button

The sessions that meet your criteria will appear in the table.
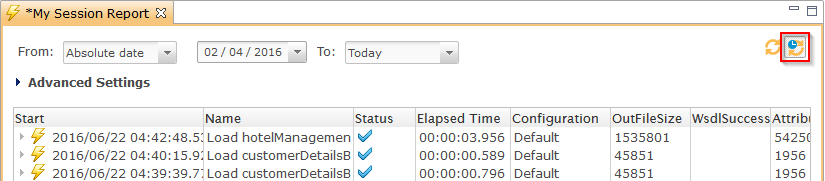
My Session Reports topic
Auto refresh
If you enabled auto refresh mode in the Preferences, the session report will be refreshed periodically using the specified delay.
You can then manage this mode on each session reports by clicking on the auto-refresh button.
| Icon | Description |
|---|---|
 |
Auto refresh is started |
 |
Auto refresh is paused |
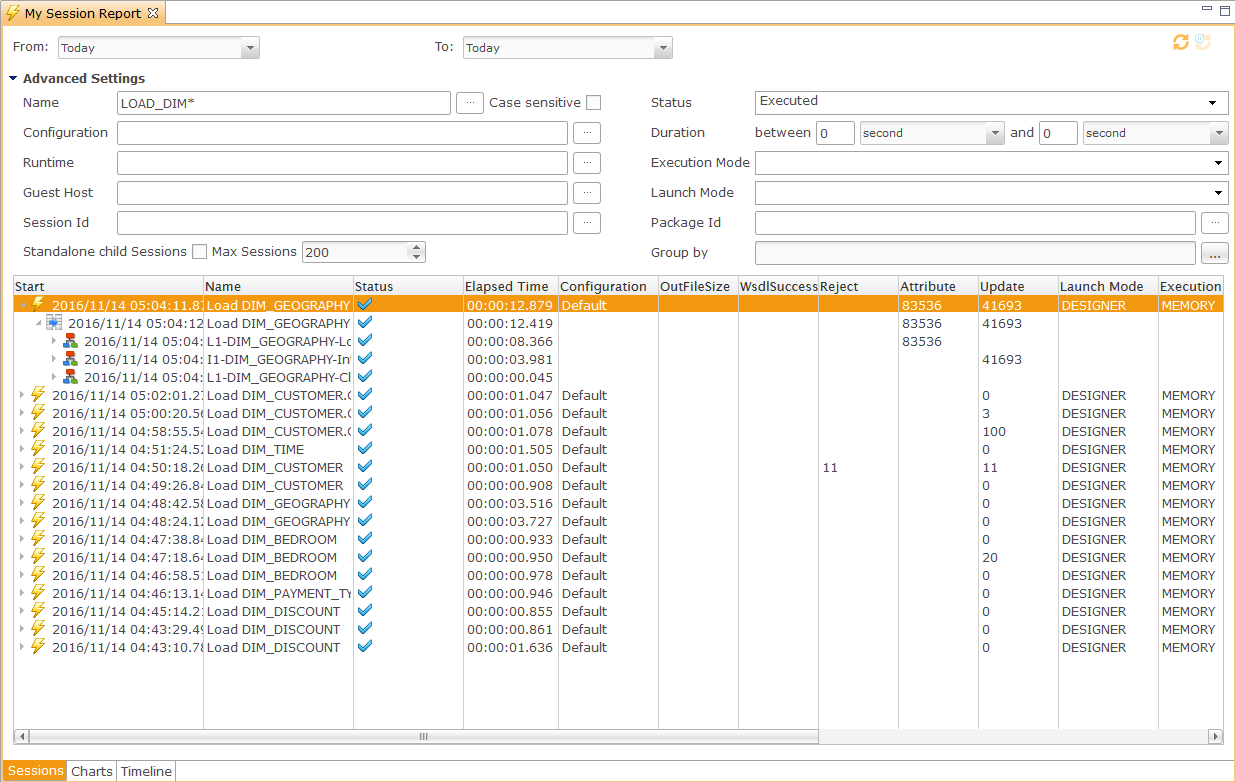
Modifying criteria
Here are the criteria that you can choose to filter your sessions:
Standard settings
- The From and the To parts allow you to set the time scope of your report:
- Today will only display the sessions executed since or until today (depending on which of the two fields From, or To you are using)
- Yesterday will only display the sessions executed from or until yesterday
- Absolute allows you to define a specific day
- Days before allows you to specify a number of days in the past.
Note: If you select the Days before criteria, the To field isn’t useful.
Advanced settings
| Criteria | Description |
|---|---|
| Name | Session’s name or name pattern. You can use the ‹*› sign to give a name pattern. |
| Configuration | Sessions with the specified Configuration(s) will be displayed. |
| Runtime | Sessions executed with the specified Runtime(s) will be displayed. |
| Guest Host | Sessions with the specified guest host(s) will be displayed. The guest host is the hostname of the machine on which the session has been executed. |
| Session Id | Sessions with the specified Id will be displayed. |
| Group By | Group the sessions according to certain fields: Status, Name, Runtime, Guest Host, Execution Mode, Launch Mode, Configuration. This will open a window in which you can add the group fields. |
| Standalone Child Sessions | If true, the child sessions will be displayed in the list of sessions as if they were standalone sessions. |
| Status | List of statuses you want to display in the session list. |
| Duration | Only the session fulfilling the specified duration will be displayed. |
| Execution Mode | Sessions with the specified Execution Mode(s) will be displayed. |
| Launch Mode | Sessions with the specified Launch Mode(s) will be displayed. |
| Package Id | Sessions with the specified package Id(s) will be displayed. |
| Max Sessions | Maximum number of sessions displayed. |
Tip: In the Group By box, the field can be ordered. That means that you can group the sessions by name and then by status, or other arrangements.
Statuses
| Status | Description |
|---|---|
| Prepared | Prepared but not executed sessions. |
| Running | Running sessions. |
| Executed | Executed sessions. |
| Error | Sessions in error. |
| Killed | Sessions killed by the user |
| Dead | Dead sessions, that is sessions that never finished and are considered as dead by Stambia Analytics |
Launch Modes
| Launch Mode | Description |
|---|---|
| Designer | The session has been executed from the Designer. |
| Schedule | The session has been executed automatically by a schedule. |
| Web Interactive | The session has been executed from Analytics. |
| Engine Command | The session has been executed from the Runtime Command utility (E.g. Using the ‹execute delivery› command). |
| Command Line | The session has been executed from command line (E.g. with startdelivery.bat). |
| Web Service | The session has been executed from the Runtime’s REST or SOAP web services. |
| Action | The session has been executed from the ‹Execute Delivery› Process Action. |
| Restart | The session has been restarted. |
Execution Modes
| Execution Mode | Description |
|---|---|
| Memory | The session has been executed in memory in the Runtime. |
| Autonomous | The session has been executed outside of the Runtime. |
Modifying the table columns
By Right-clicking on the sessions table header, you can choose the columns you want to display.
Note: The modifications are saved for each user through cookies. If the cookies are not allowed, the modifications will be discarded when the user exits his web session.
The views
Around the sessions table, some views are useful to retrieve knowledge about the session when you click on it in the sessions table.
- The Statistic view
 gives the aggregated statistics on the session.
- The Variable view
 gives the main variables of the session
- The Information view
 gives an overview of important information (this information is the same as information you will find in the variable view or the sessions table)
The session detail
Entering a session detail
You can enter into a session’s detail by double-clicking on the session’s row in the sessions table.
This will open a new window, in which the session execution tree will appear.
The tree can be opened.
The views
Clicking on each node of the tree will synchronize the information displayed in the different views.
- The Statistic view gives the aggregated statistics for the selected step
- The Variable view gives the variables for the selected steps
- The Information view gives an overview of some important information for the selected steps. If the steps contain an executed text (for example a SQL order), an executed code tab appears in this view.
- If clicking on a step that has a text code, the Executed view
 gives the final executed code.
Modifying the displayed information and the session status
In the upper-right side of the session detail window, buttons can be pressed in order to select the information displayed in the tree.
- The Message button
 allows to display the user messages. Theses messages should have been planned by the Process Designer.
- The Details button allows to display the detail of a session (by default, this button is pressed)
- The Warnings button
 allows to display only the details having warning messages.
- The Errors button
 allows to display only the details having error messages.
- The Stop button
 stops the current sessions if it is running.
- The Restart button
 restarts the current session when it is in an error status.
- The Refresh button refreshes the session tree. This is useful when the session is running.
Visualization of sessions
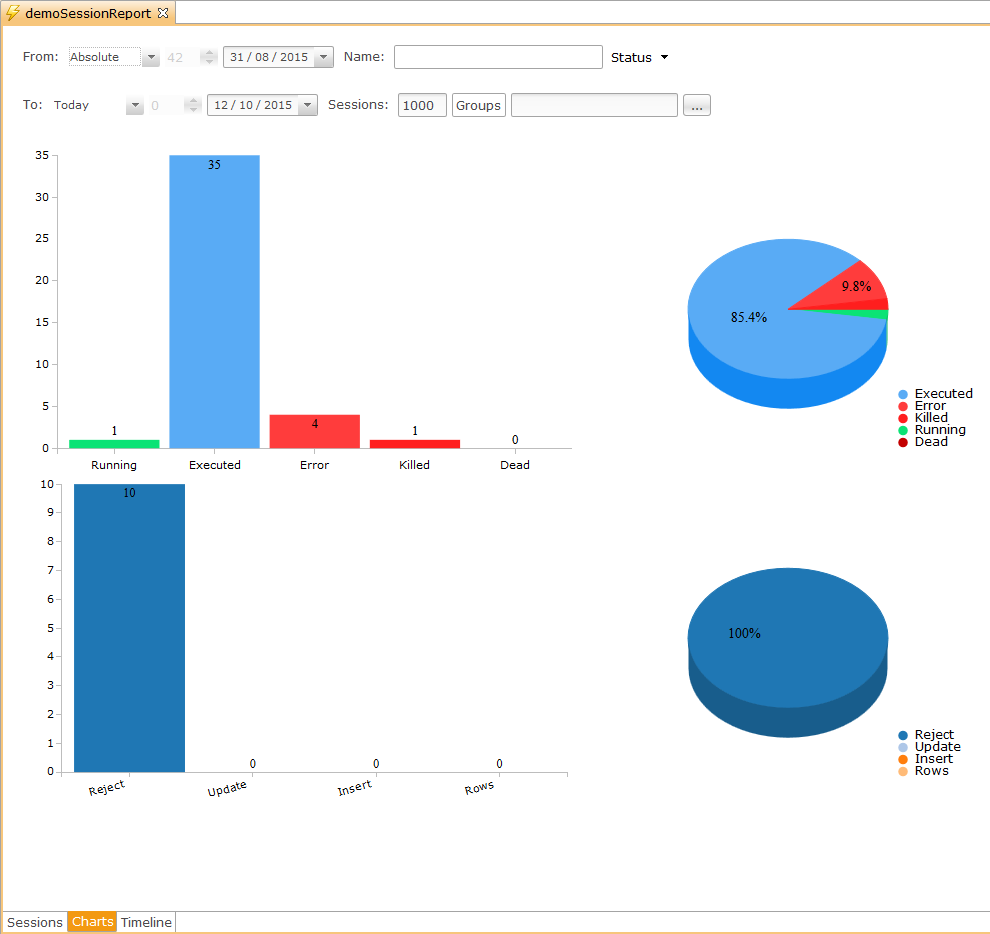
The Charts tab
The Charts tab gives some graphs that summarize the statistics of the sessions.
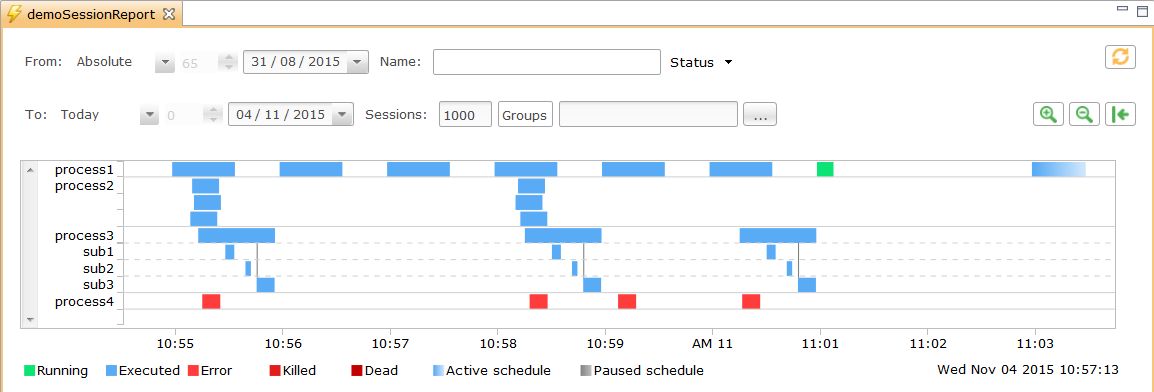
The Timeline tab
The Timeline tab shows sessions' executions over time.
To navigate in the timeline:
- Maintain left click and move left and right to go through time
To zoom in and out:
- Use the mouse wheel
- Double click on an empty place
- Maintain right Click and select the zone on which you want to zoom in
- Use the zoom buttons


To view the information of a session:
- Left click on the session. Information appear on the dedicated views
- Double click on a session to open the Session detail
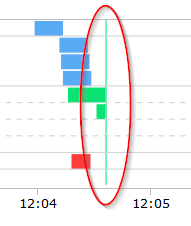
Timeline Legend:
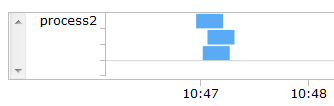
Full line: Normal execution
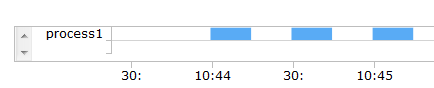
Multiple blank separated lines: Same session executed in parallel.
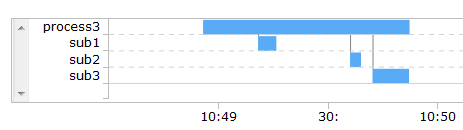
Dotted lines: child sessions
Gradation: Sessions scheduled.
Analytics analyze the already executed sessions and estimate the time for future scheduled one’s.
The Fifty next schedules are shown.

Current time:
Restarting or stopping a session
To restart or stop a session there are two ways:
- In the session list or on the session detail tree, a right-click allows to restart or stop the session.
- In the session detail, the button bar has two buttons to restart or stop the session.
Getting the documentation on a Process
If the Deliveries have been built through a package including the documentation, all the sessions running with theses will be linked to the documentation.
In this case, the documentation is accessible at different locations:
- On the sessions list, by a right-click on the session. In this case, it will open the Process documentation.
- In the detail of a session, by a right-click on a session’s tree node. In this case, it will open the documentation of the specific node (step of the Process).
- Inside the Deployment Manager, by a right-click on the Package including the documentation.
Managing Runtimes
In the Navigator View , under the Runtimes topic  , will be listed all the Runtimes defined in the parameters.
If the list is empty, check if a profile is selected in the combo box under the main menu.
Runtime detail
By a double-click on a specific Runtime, a new window will appear.
This window has several tabs:
- The monitoring tab gives information on the clients connected to the Runtime and on the session’s thread running on the Runtime.
- The Virtual Machine tab gives real-time information on the Java Virtual Machine on which the Runtime is running.
- The Test tab is useful to make some tests directly on the Runtime. You can test an IP route (to know if an IP port is available from the Runtime towards another host), or you can test the existence of a Folder (directory) on the Runtime server.
- The Purge tab is used to schedule a purge for the Runtime log database. You can add, edit or remove purges with the corresponding buttons. You can configure on a scheduled purge how many sessions, days, etc are kept, when it is executed, ...
- The Command tab allows to execute Runtime commands.
Runtime Deliveries
A Delivery can be opened by a double-click on it. The opened view allows to execute, restart or delete a session for this Delivery.
A session list is automatically displayed, filtering on this Delivery.
The criteria can be modified in order to refine the session list.
A right-click on the Delivery in the navigator view allows to execute or define a new schedule.
Note: When executing Multi-Configuration Deliveries, a selection window will open to choose the Configuration to use.
Scheduling a Delivery
In order to schedule a Delivery:
- Right-click on the Delivery in the Navigator View
- Choose New Schedule

- A new window appears, allowing you to define the schedule.
- In this new window, each tab Second, Minute, Hour, Day, Month, Year should be filled according to the schedule you want to create.
- This will generate a sort of cron expression that will be sent to the Runtime when the schedule information will be saved.
Note: For Multi-Configuration Deliveries, a Configuration must be selected in the corresponding combo box.
Managing Deployment Managers
Introduction
Deployment managers allow you to customize, configure and manage the deployment of the integration processes developed on the Designer tool.
A Deployment Manager will contain Packages, Deployment Specifications and topology information (connections, metadata configuration).
Creating a Deployment Manager
In the Navigator View , under the Deployments topic  , will be listed all the Deployment Managers that have been created.
To create a new Deployment Manager:
- Right-click on the Deployments node in the Navigator View
- Choose New Deployment Manager

- Give a name and click on Finish
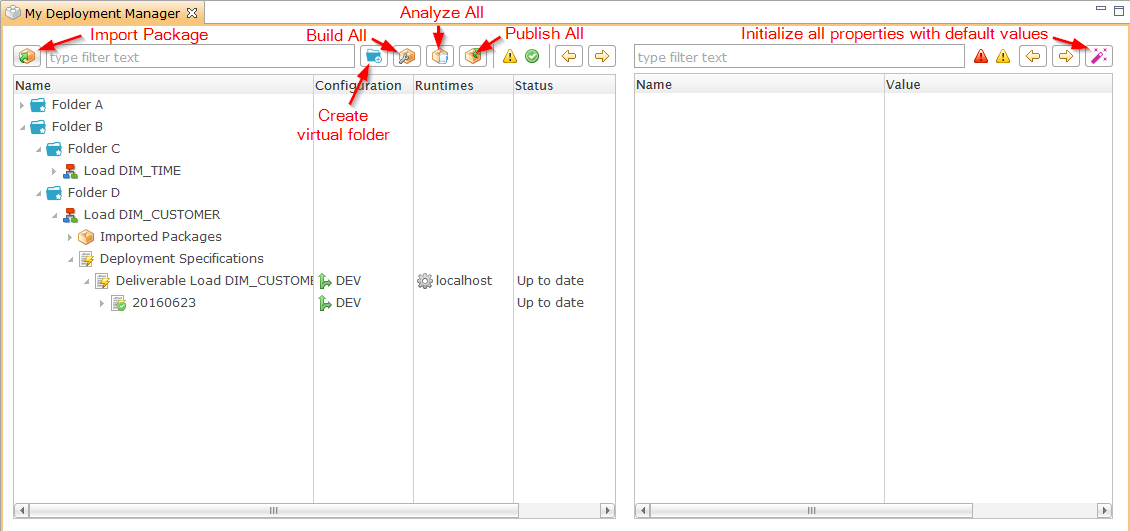
Deployment Manager View:
The arrows ![]()
![]() are used to navigate through the items with missing settings.
are used to navigate through the items with missing settings.
The Deployment process
In a Deployment Manager, you will be able to
- Import the Packages generated through the Designer tool by the people who have designed the integration processes.
- Define new Configurations. For instance you can define production or preproduction Configurations.
- Define Deployment Specifications on Packages, which allow to customize the Package deployment and metadata properties through the specified Configurations.
- Build a Delivery
- Deploy this Delivery on the Runtimes
- Manage the versions and check differences
Importing a Package
To import a Package:
- Open the Deployment Manager
- Click on the Import button

- Browse and choose a Package file, the extension of which is .pck
The package  will be imported and attached to the Process
  node.
node.
Different packages files can be attached to a same Process node, according to their unique identifier.
The default name used for the imported Package is the import date.
To import multiple packages at the once, simply make a zip archive containing all your packages and import it with the Import button
The packages must be at the root of the archive and only .zip files are allowed.
Organizing Packages
You can structure your Deployment Manager using virtual folders  .
.
This allows to organize and arrange your packages under a folder tree.
To create a folder, click on the New Virtual Folder button.
You can create as many folder/sub-folders as you need.
Then, simply drag and drop your packages between folders to organize them.
Defining Configurations
You have to define the Configurations  that will be used to configure the Delivery’s metadata.
To define a new Configuration:
- Click on the Configuration tab in the Deployment Manager
- Click on the Add button
- On the right side fill the Name field that will be the unique identifier of the Configuration.
- Don’t forget to save.
Note: The Configurations could be, for instance, PROD, PREPROD, or TEST.
Composed Configurations:
The Configuration can be configured to inherit from other existing Configurations with the Parents field.
To define a new Composed Configuration:
- Click on the button
 near Parents field.
 - This will open a new Window in which you will select the desired Configurations.
Note: The order is important as it will define the inheritance order: the values of the lowest Configuration will be taken, if a value is not found, the value of the upper configuration will be taken, and so on...
Creating a Deployment Specification
Once you have imported a Package, and you have defined at least one Configuration, you will be able to create Deployment Specifications  and configure the metadata.
To create a Deployment Specification:
- Right-click on the Process node
- Choose New Deployment Specification
- On the specification , specify one or multiple Configurations by clicking on the button near Configurations property.
- This will open a new Window in which you will choose the Configurations you want to associate to your Specification.
Note: # You can have multiple Configurations associated to a Deployment Specification. It offers the possibility to execute a delivery with different Configurations, useful for testing with different values, for example.
# Do not confuse this with a Composed Configuration, which is a single Configuration that inherits from other ones.
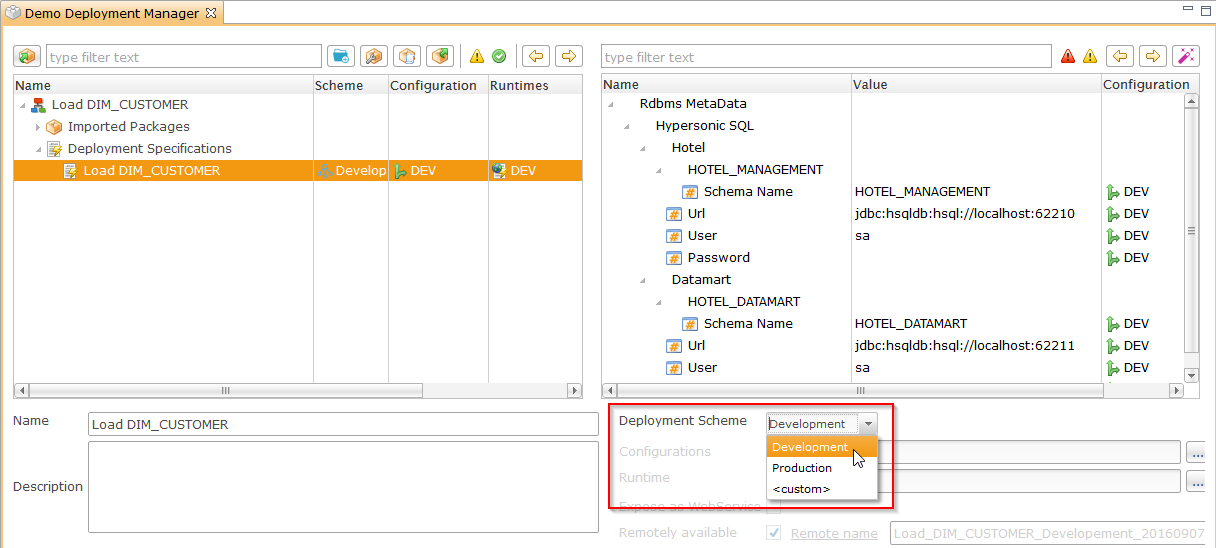
Configuring the metadata properties
Once the Deployment Specification is created and associated to one or more Configurations, you will need to configure the metadata properties on these specified Configurations.
- Click on the Deployment Specification.
- On the right part will appear the list of the metadata that you need to configure.
If the Error icon appears on property, you have to configure the metadata, because it has not been configured before.
If the Configuration icon appears, then the metadata is correctly configured.
Several Packages can share the same metadata. In this case, some metadata could already be configured due to a previous deployment work.
You can filter all properties which need to be configured by clicking on the error icon on the top of Configuration table, next to the text filter.
To define the metadata:
- Click on the property that you want to configure
- On the bottom part, the property will appear with its imported value. This is the value that has been exported from the design moment when the Package was created.
- You can keep the same value by clicking on the Configuration link
- Or you can define your own value by filling the text area
- Do this for each property that has the Error icon
Note: For composed Configurations, you can see that all the parents appear in this window. If a value is not set, the value from the parent will be taken.
Tip: Use the Initialize
top button to set all the missing values to the default package values.
Remotely available deliveries
You can set a delivery as Remotely Available.
A Runtime configured to access to the Deployment Manager will fetch the latest version of the delivery before executing it.
- Click on a Deployment Specification.
- Check Remotely Available.
- Optionally, change the remote name, which by default is the process name.
Building a Delivery
Once all the metadata are configured, a Delivery can be built from the Deployment Specification.
- Right click on the Deployment Specification node , and choose Build Deliveries.
- This will create a new version of Delivery and place it under the Deployment Specification node.
Note that you can build Deliveries from any nodes (Specification, Process, Folder, ...) with right click and Build Deliveries.
This will create a Delivery for each child of the node.
Note The metadata configured on a built Delivery cannot be modified. If a modification needs to be done, update the Deployment Specification, and build a new version.
Tip: Click on the top Build All button
to build Deliveries for the entire Deployment Manager.
Deploying Deliveries on the Runtimes
A version of a Delivery can be deployed on Runtimes.
To proceed, you’ll first have to associate one or more Runtimes to the Deployment Specification.
- Click on the Deployment Specification
- Click on the button near Runtime property.
- This will open a new Window in which you will choose the Runtimes you want to associate to your specification.
After associating one or more Runtimes, you can deploy Deliveries to them.
There are three ways to do it:
- On the Delivery
- Right click on the Delivery and choose Publish Delivery
- On any node of the tree (Specification, Process, Folder, ...)
- Right click and choose Publish Deliveries
- This will open a new Window in which you will select the Delivery to publish and on which Runtime.
- Alternatively, you can also decide to download the Delivery file and deploy it manually on the Runtimes.
- Right-click on the Delivery
- Choose Download Delivery
Note: You can only deploy the Delivery on a Runtime by a Publish operation if the Runtime is started (on-line) and accessible.
Tip: Click on the top Publish All button
to publish all Deliveries of the Deployment Manager.
Defining Deployment Schemes
Deployment Schemes can be used to automate the configuration of Deployment Specifications.
A Scheme is simply a pre-configured Specification where you can define the Configurations, Runtimes, and options that must be used.
After defining a Scheme, you can choose to use it on the desired Deployment Specifications using the Deployment Scheme box.
Warning: When updating a Scheme, all the Deployment Specifications using it will be impacted.
To define a Deployment Scheme:
- Click on the Deployment Scheme tab in the Deployment Manager
- Click on the Add button
- On the right side fill the Name field that will be the unique identifier of the Deployment Scheme.
- Define the properties accordingly to your requirement: Runtime, Configuration, ...
- Don’t forget to save.
The ‹Use as default Scheme› property allows to specify that the Scheme must be used automatically on newly created Deployment Specifications.
The ‹Remote name mask› property can be used to define dynamically the remote name of the Specifications using the Scheme.
This allows to use the same Scheme on multiple Specifications by using the following masks:
| Mask | Description |
|---|---|
| [Scheme] | Name of the Scheme. |
| [Package] | Name of the Package. |
| [DeploymentSpec] | Name of the Deployment Specification. |
The masks will be replaced automatically with their values on the Specifications using the Scheme.
You can moreover use the Generate Schemes button to automatically create all the Schemes corresponding to the existing Deployment Specifications.
After clicking on this button, Analytics will generate the Schemes and let you choose if you want to use the newly created Schemes on the Deployment Specifications.
Managing Delivery versions and checking the differences
The current and default versions
Packages
If you import new versions of a Package you have imported before, the last imported Package will become the current used version of the Package  .
.
A new icon  will be added to specify that this Package is the one used to generate the Deliveries.
Delivery versions
If you create a new version of a Delivery, the last Delivery version you created will become the current version of the Delivery  .
.
A new icon will be added to specify that this Delivery version is the last version.
Checking the differences
- Differences between metadata and the built version of the Delivery
If there are differences between the Delivery metadata and the version of the Delivery, a warning icon  will appear on the objects (tree nodes and metadata properties).
This is probably because a metadata has been changed before the Delivery was built.
- Differences between the built version and the deployed version on the Runtimes
You can check the differences between the built version of the delivery and the version deployed on the Runtimes. This is available if you defined Runtimes for this Delivery.
Under the current version node you will see the Runtimes  on which different statuses can appear.
A warning icon will appear if a difference is found.
A question icon  will appear if the difference is unknown.
A green checked icon will appear if the built Delivery and the deployed Delivery are correctly synchronized.
To check the differences:
- Right click on the Runtime under the current version node and choose Analyze.
- Right click on any node of the tree and choose Analyze Runtimes.
Tip: Click on the top Analyze All button
to analyze all the runtimes.
Restoring a previous version
It is possible to restore a previous version of a Package or a Delivery.
- To change the current Package, click on the Current Package check box.
- To change the current version, click on the Current Build check box.
The default green icon will appear on the element you have selected.